2018 Newlywed Report Provides Insight on Engagement Behaviors, Financial Habits, Planning and Trends from Nearly 18,000 Americans
CHEVY CHASE, Md., March 14, 2018 /PRNewswire/ — WeddingWire, Inc., the global online leader connecting engaged couples with wedding professionals, released today results from its 2018 Newlywed Report, the largest and most comprehensive current industry report. The report looks at behaviors of 17,862 newlyweds and provides insight into real, modern-day couples and their journeys through getting engaged, searching for and selecting their vendors, and spending money planning for their big day.
“By having the largest current report of its kind, WeddingWire is in the unique position to provide the most comprehensive insights about modern wedding journeys in the U.S. — including engagement habits, planning and spending patterns, vendor decisions, and trends and traditions,” said Lauren Goodson, Director of Insights, WeddingWire. “We are excited to see that while many wedding fundamentals have stayed consistent, there are a number of noteworthy progressions and evolutions, including more prominent celebrations for LGBTQ couples (with an increase in guest size and parents’ financial contributions) since the Supreme Court ruled in favor of same-sex marriage nationwide, and the increased reliance on technology to pull off a unique and personalized wedding celebration.”
The 2018 Newlywed Report sheds light on couples’ entire wedding processes. Some of the most notable findings from this year’s report include:
Blurring Lines of Tradition
While some traditional elements remain common for modern-day Millennial couples, like getting down on one knee (82 percent) and asking parents for their blessing (72 percent), other traditions are becoming less practiced, like one partner changing his or her last name (70 percent — down 12 percent over the last two years) and taking a honeymoon within a few days of the wedding (less than half — down 12 percent over the last two years).
In addition, the continued focus on personalization and custom touches creates shifts in tradition. For example, 40 percent of couples now incorporate mixed gender wedding parties (up 14 percent in the last two years), and nearly 60 percent of female bridesmaids wear different dress styles on the couple’s big day (up 14 percent over the last two years).
Engagements: A Public Affair
The most popular time for proposals remains between Thanksgiving and Valentine’s Day, with nearly 40 percent of couples getting engaged during that time. Do not assume they haven’t gotten a wedding-planning jumpstart already, as three-in-four couples admit to starting before they even get engaged!
Millennial couples specifically have an increasing desire to incorporate friends and family — both near and far away — into their proposals. While one-in-four invite others to witness the proposal, over half tell friends and family about their plans in advance, and 86 percent share on social media — nearly 70 percent post their “just said yes” moment within a few hours!
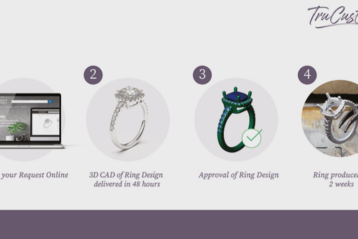
For more than half, the ring is still a surprise, but it is a growing trend to discuss preferred styles before a proposal. Dropping hints, shopping around and purchasing online (over 30 percent of couples do this) are more frequent behaviors, with one-in-three showing their partner a picture of a ring and/or style they like, and 54 percent looking at 2-7 rings before making a purchase. With the average price of an engagement ring at $5,000, it’s important to feel confident about the decision. The most popular ring characteristics for females are a diamond stone (74 percent), halo setting (53 percent) and 1-2 carats in size (50 percent).
Planning: Here, There, Everywhere
The biggest planning pain points for couples include setting budgets and finding vendors. Fortunately, online resources like budget trackers, web-based checklists and vendor directories can simplify the process.
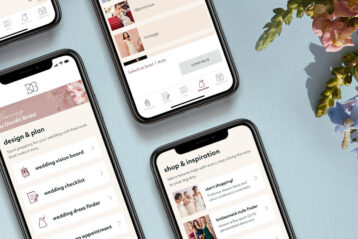
Couples’ reliance on technology throughout their wedding journey has continued to increase, with 83 percent of planning done online and 42 percent of that online planning being from a mobile device or tablet. Additionally, over half use a wedding planning app to further simplify the extensive planning process, and 62 percent create a wedding website to host easily-accessible event details for guests. While technology is prominent, when it comes to the big day, one-in-four ask guests to “unplug.”
Although couples largely use wedding related websites to identify their vendors, they rely on recommendations and reviews when it comes to actually making hiring decisions (on average, couples hire 13 vendors). For inspiration, Pinterest takes the front seat. Couples use this platform two-times more than any other social media site.
Day-of Details
Much like sharing proposals, more and more couples (54 percent) are generating a wedding hashtag for photo-sharing for wedding events — but especially on their big day.
The favorability of fall nuptials continues to be on the up, with Saturdays in autumn as the most popular wedding date decision. Nearly 40 percent of all weddings take place during this season, and none of the top wedding dates include summer days, which were traditionally the most favored.
Couples underestimate their ceremony and reception costs by about 40 percent. The average cost of a couple’s all-in wedding spend — including the engagement ring, ceremony/reception and honeymoon — is $36,000. With an average spend of $216 per guest for ceremony and reception related costs, an easy way to cut costs is to trim the guest list. And while 20 percent of Millennials don’t put any of their own money towards their wedding, couples on average contribute to 45 percent of costs, while their parents foot the bill for 46 percent. When parents are contributing to the overall wedding budget, they’re often pulling from their savings accounts (56 percent) or putting purchases on a credit card (20 percent). Additionally, nearly one-in-ten parents of Millennial couples dip into their retirement savings to cover wedding-related costs.
Today’s Couples
Although no two couples are alike, there are some prevalent nuances that have evolved over the years. Couples are not only older to wed (the average age is now 32), but also more likely to live together before marriage (79 percent). In addition, one-in-four find love online.
While some traditions have stood the test of time (sharing a first dance), new trends are emerging (walking down the aisle to non-classical music). Couples are getting more creative when it comes to making their special day feel undoubtedly “them.”
- 40 percent have unique musical choices during the ceremony (e.g. bagpipes).
- 21 percent add local elements based on the city where the couple met or grew up (e.g. food or decor).
- 18 percent include ceremonial customs related to their ethnicity/religion (e.g. jumping the broom).
- 17 percent hire special or out-of-the-box entertainment for guests (e.g. fortune tellers, caricature artists).
About WeddingWire, Inc.
WeddingWire, Inc. is the leading global online marketplace, connecting consumers with local wedding professionals and a suite of comprehensive tools that make wedding planning easier. Operating within a $200 billion industry, WeddingWire helps 13 million couples every month find the right team of wedding professionals to personalize and pull off their special day. Consumers around the world are able to read more than 5 million vendor reviews and search, compare and book from a directory of over 400,000 vendors. Founded in 2007, the WeddingWire portfolio serves couples and wedding professionals across 15 countries in North America, Latin America, Europe and Asia. The company has more than 900 employees and is headquartered in Washington, D.C. with international headquarters in Barcelona, Spain. Visit WeddingWire online at WeddingWire.com and follow us on social media at Facebook.com/WeddingWire and @WeddingWire on Instagram, Twitter, and Pinterest.
Contact:
Stephanie Colpo
WeddingWire
[email protected]
301.231.9473
SOURCE WeddingWire, Inc.


